Erin's Statistics Portfolio
Down below is a collection of all the work I have done in statistics and probability
|
Chapter 2 Project
|
|
For Chapter 2, my partner and I collected data from MLB.com. We found data for the top 50 batting averages in the MLB in 2015. After using the data to make multiple graphs we were able to come to a few different conclusions. We found out which players had the best batting averages, the lowest batting averages and what players will be most likely to perform well in the future.
|
|
Chapter 3 Project
For this chapter my partner and I surveyed every other upperclassman at FHS and asked them how many pets they currently have. The type of survey we conducted was a sample because we did not survey a whole population. From the data collected, my partner and I were able to determine mean, median, mode, range, 5% trimmed mean, standard deviation, and more.
|
|
For this chapter, my partner and I surveys students on how many hours of sleep they get and what their GPA is. The purpose was to find out if there is a correlation between sleep and how well an individual performs in school. Our prediction was that students who got more sleep would have better grades. We were surprised to find that the correlation was not that strong.
|
|
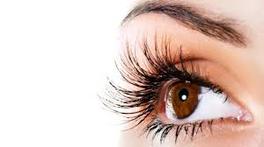
For this chapter, my partner and I were assigned a topic that would demonstrate probability. Our scenario was two blue/brown eyed children being born from Bb and Bb parents. We found that the odds of the two children having blue eyes was 25% and the odds of the two kids having brown eyes was 75%. We also were able to conclude that one kid could have brown eyes and the other could have blue, making the events mutually exclusive.
|

|
Chapter 6 Project
For chapter 6, my partner and I wrote a brief summary on everything we learned in the chapter. This included concepts such as random variable, discrete vs. continuous, probability distributions, and more. Then we completed a problem in the book about the power ball lottery. We calculated concepts such as the probability of winning the power ball and the probability of winning at least one prize once. |
|
Chapter 7 Project
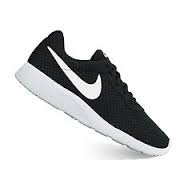
For this chapter, my partners and I ran a survey on how many pairs of shoes the average teenager owns. We sent an online survey to every other senior and every other junior at Fowler High School. After all data was collected we found that the average for the data was 11.41. We also calculated other factors such as standard deviation and a five number summary. |
|
Chapter 8 Project
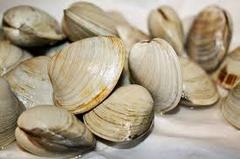
For chapter 8, my partner and I were given data for the lengths of little neck clams (mm) in a specific bay. We used this information to calculate a few different quantities such as sample size, sample mean, and sample standard deviation. We also were able to calculate critical values for different confidence levels. |

|
Chapter 9 Project
For this project, my partner and I decided to survey a random sample of 30 Fowler High School seniors. We asked them to tell us the average number in minutes that they spend on Facebook a day. This includes liking, scrolling, posting, commenting, etc. We took the data we collected and compared it the world's average of 20+ minutes. |
|
Chapter 10 Project
For this project my partners and I were assigned a problem in the book and using this problem were able to calculate a few different quantities. We found the null & alternate hypothesis, best estimates for success/failure and more. In the end we concluded that it was correct to reject the null hypothesis. |